
Hello everyone,
In this article, I’ll be talking about AWS’s newly announced EC2 Capacity Manager. This new feature is one of the most valuable additions to centralized resource management, following the previously released EC2 Global View.
Previously, monitoring, analyzing, and optimizing EC2 cost and usage required using multiple solutions such as CloudWatch, Cost and Usage Reports (CUR), Cost Explorer, EC2 APIs, Savings Plans & Reserved Instances dashboards, and CUDOS, or relying on various third-party tools.
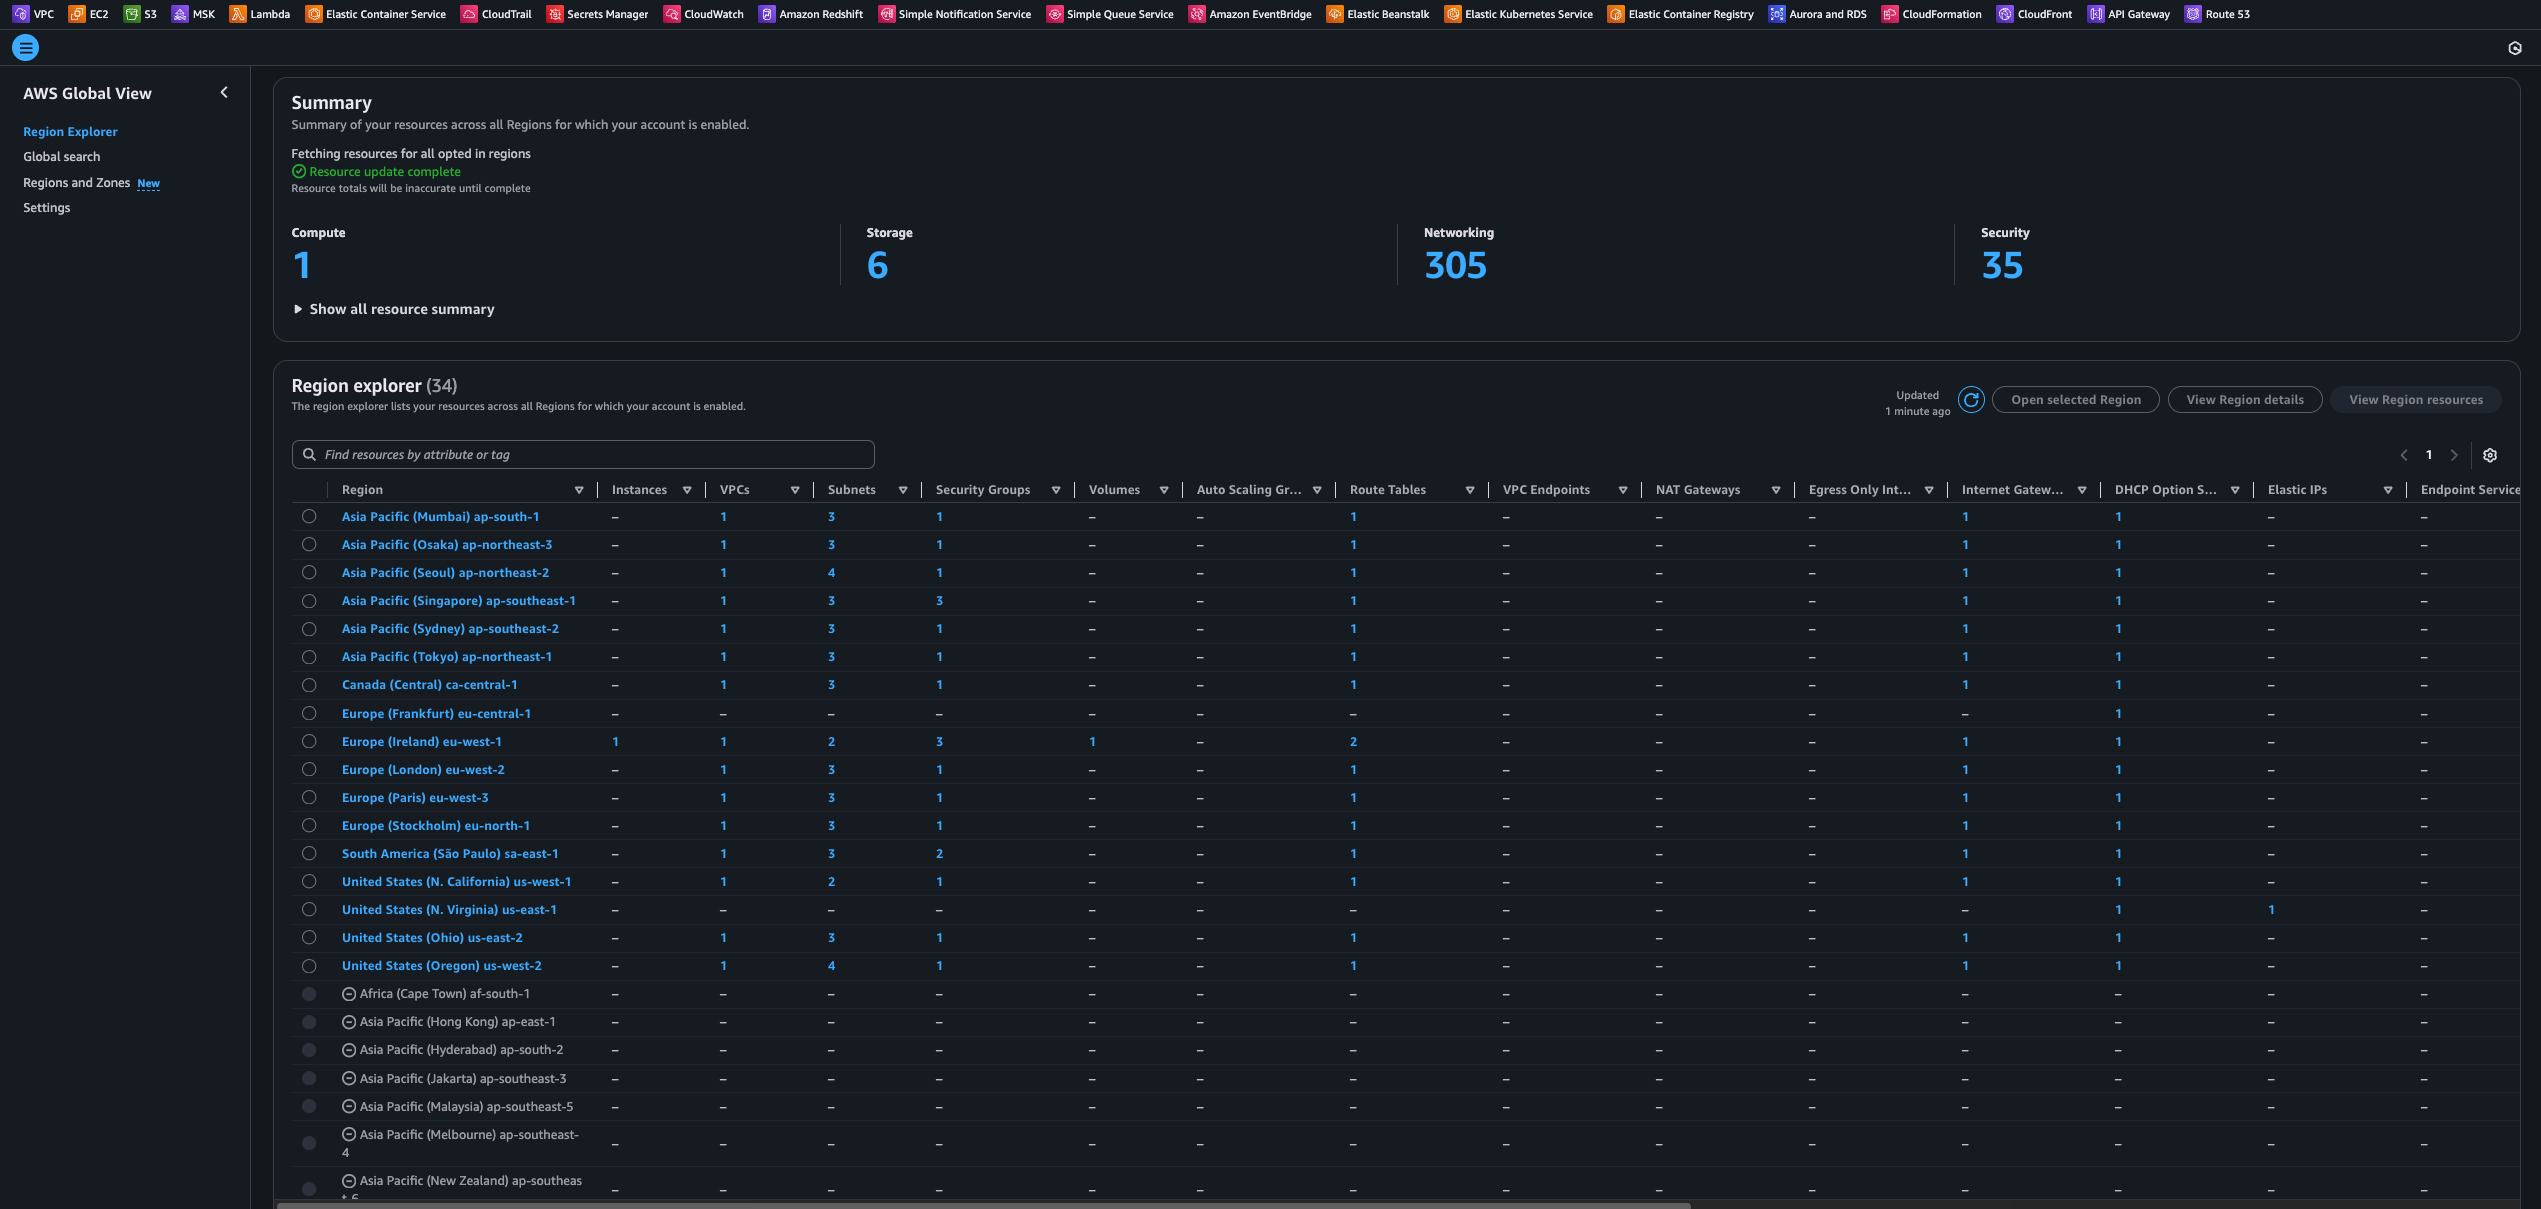
Just as Global View provides a global perspective of which compute-related services are running in different regions within an AWS account, this new feature brings together nearly all of the elements mentioned above into a single interface focused on cost visibility.
It can also be enabled at the organization level instead of managing each account separately. This makes it possible to view Savings Plans (SP) or Reserved Instance (RI) utilization across accounts and to examine interruptions or fluctuations in Spot Instance usage. The generated reports can be exported and imported into PowerBI or QuickSight for further analysis.
I have also submitted a feature request to integrate Compute Optimizer into this portal. Once added, it will allow viewing how much each EC2 resource is utilized and whether further optimization is needed, directly from the same page. BUT I don’t think this suggestion will be very likely to be accepted, since this solution is completely free, while Compute Optimizer becomes a paid service at a certain point. Still, there’s always hope, we’ll see 🙂
I’ve outlined the core functions of EC2 Capacity Manager below, categorized under their respective sections. You can review them for a quick summary:
- Collects and analyzes EC2 capacity usage across all AWS accounts and Regions.
- Refreshes data hourly to ensure up-to-date insights.
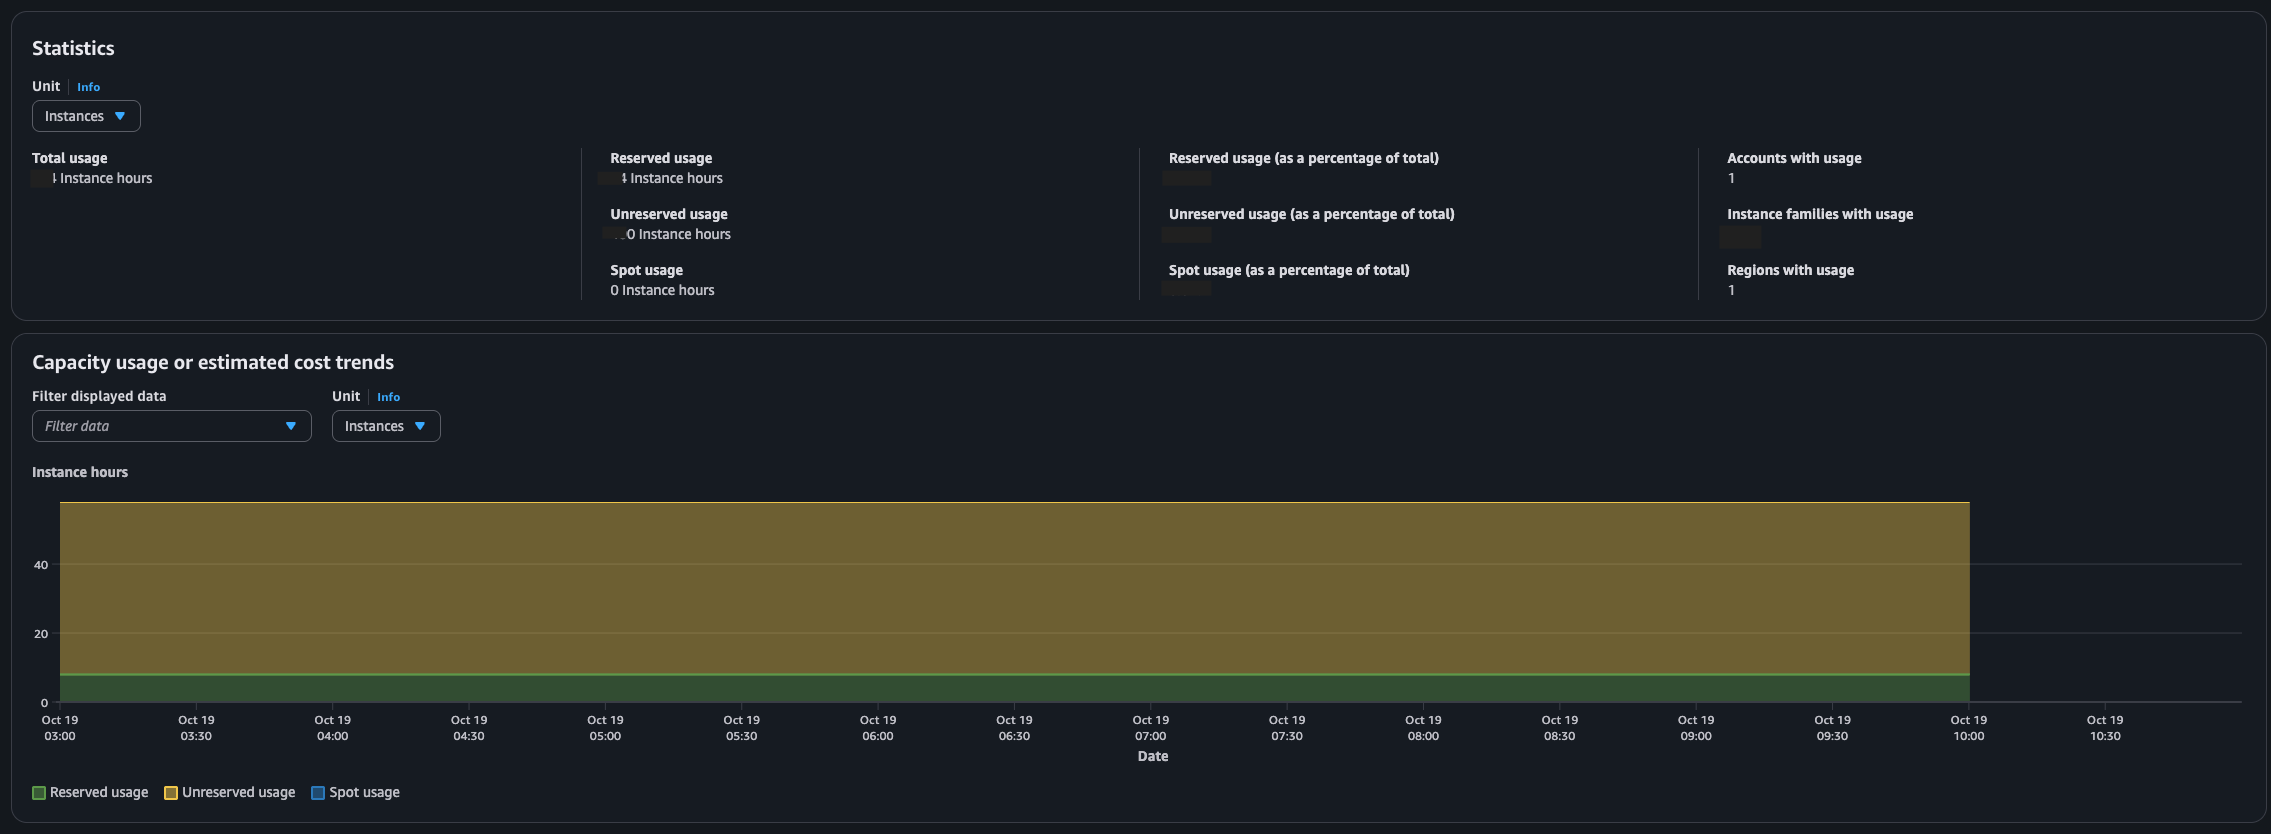
- Displays combined metrics for On-Demand Instances, Spot Instances, and Capacity Reservations.
- Provides a single pane of glass for capacity planning, reservation efficiency, and usage optimization.
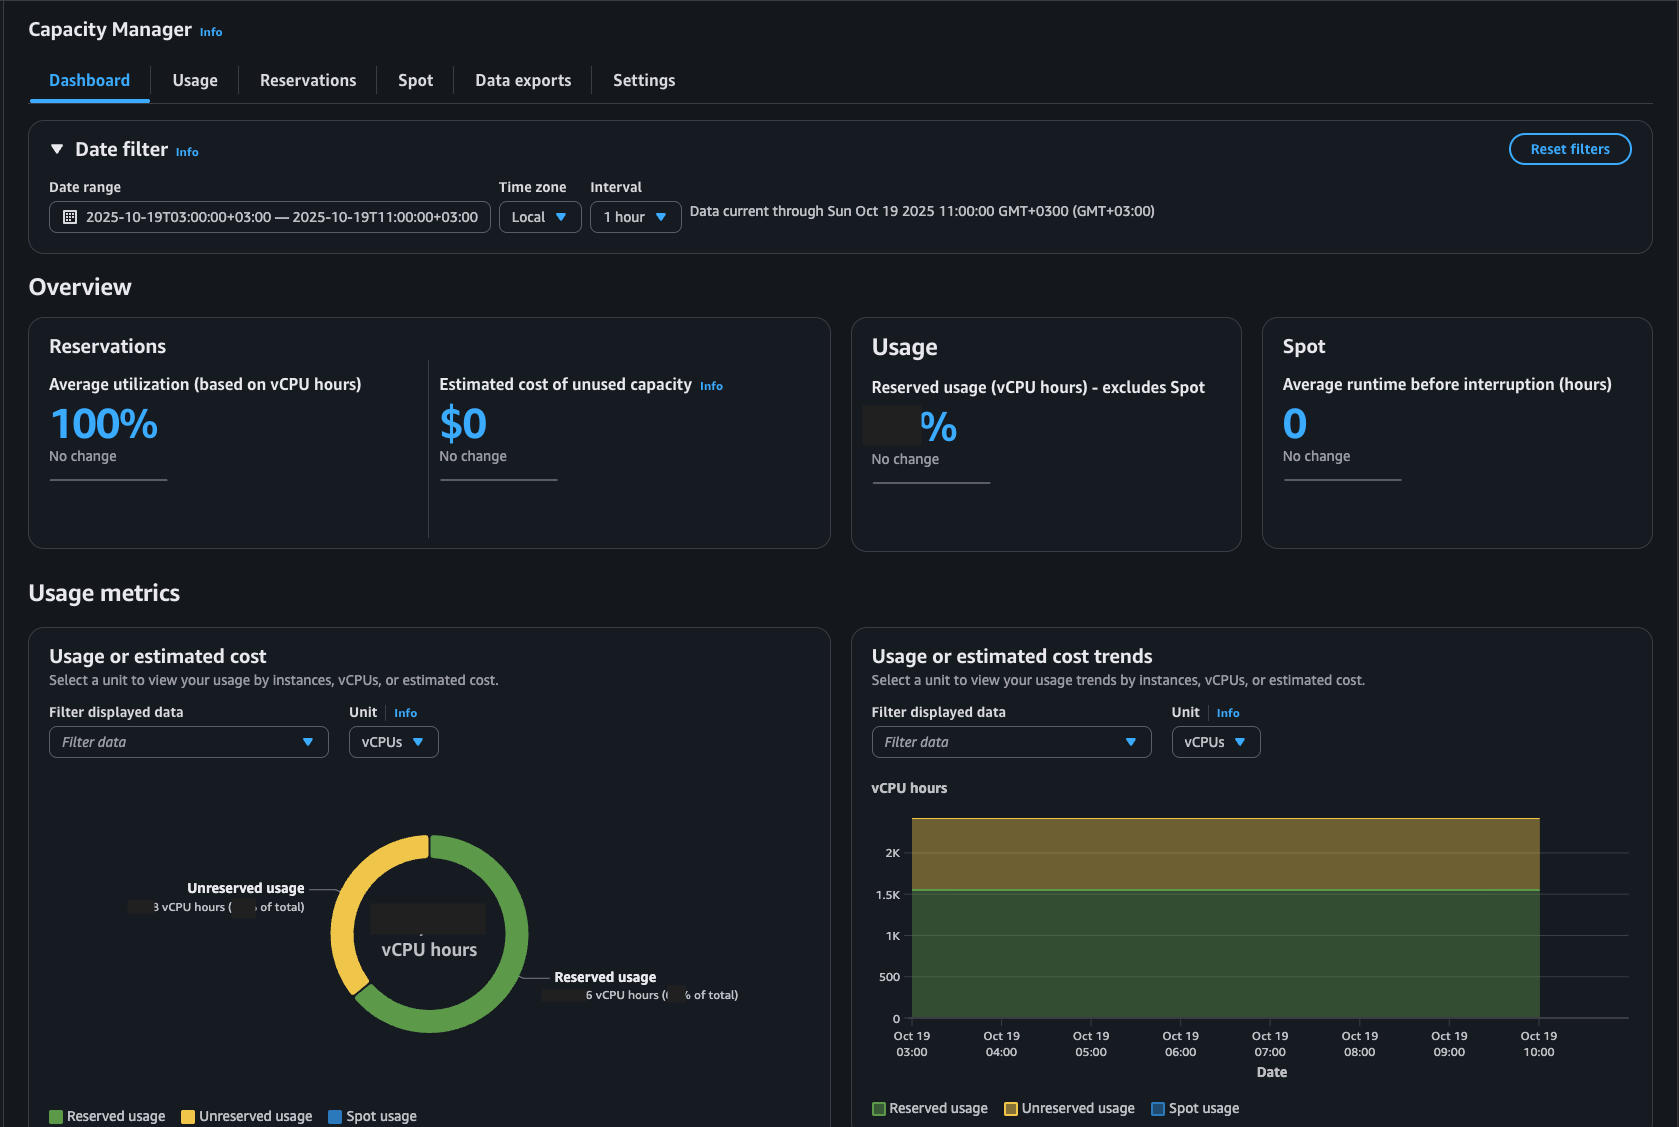
- Displays comparative usage data for Spot, On-Demand, and Reservation instances across all Regions.
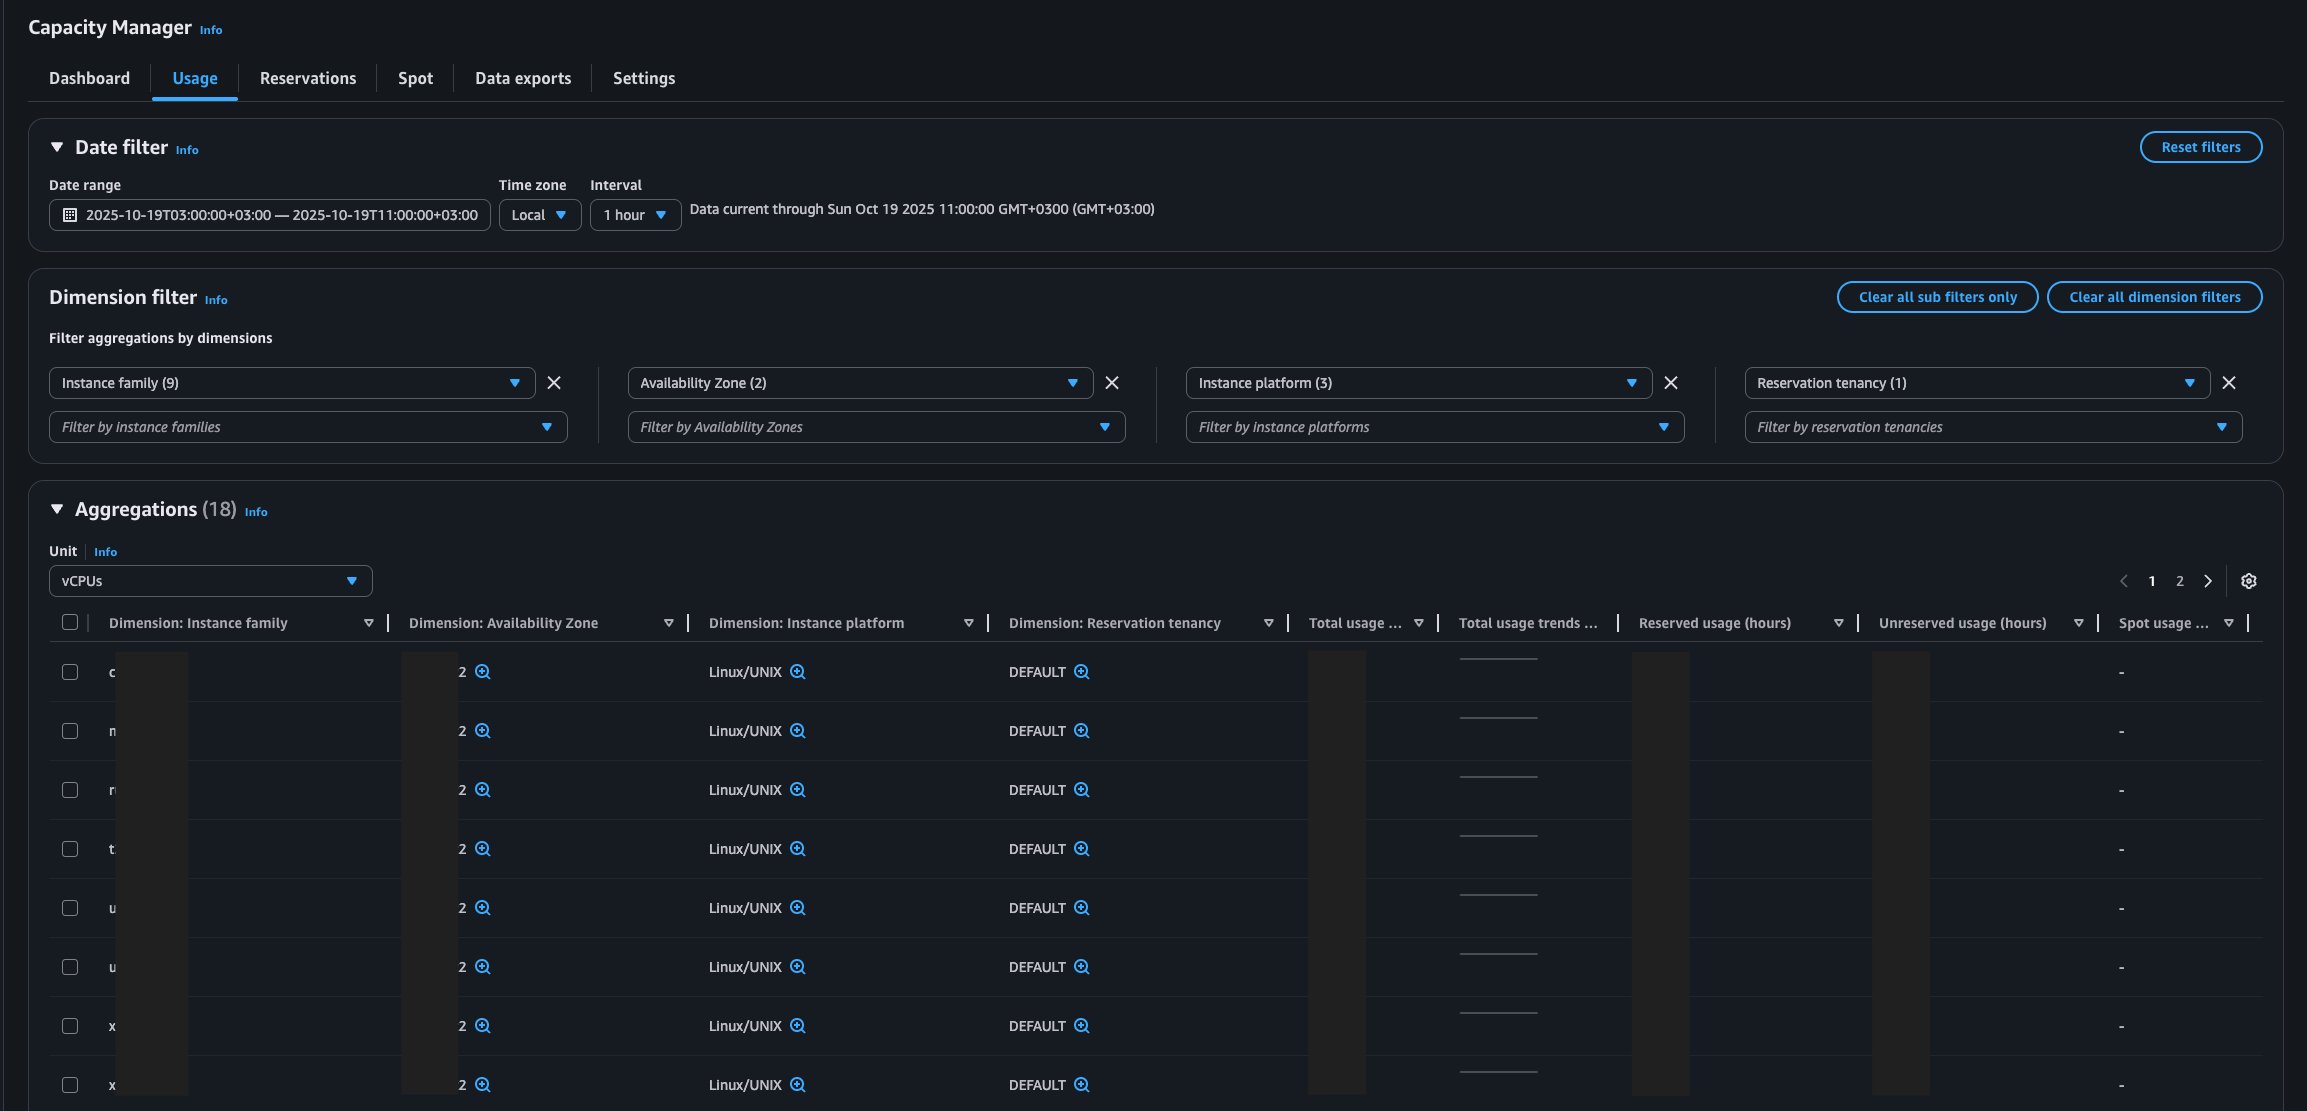
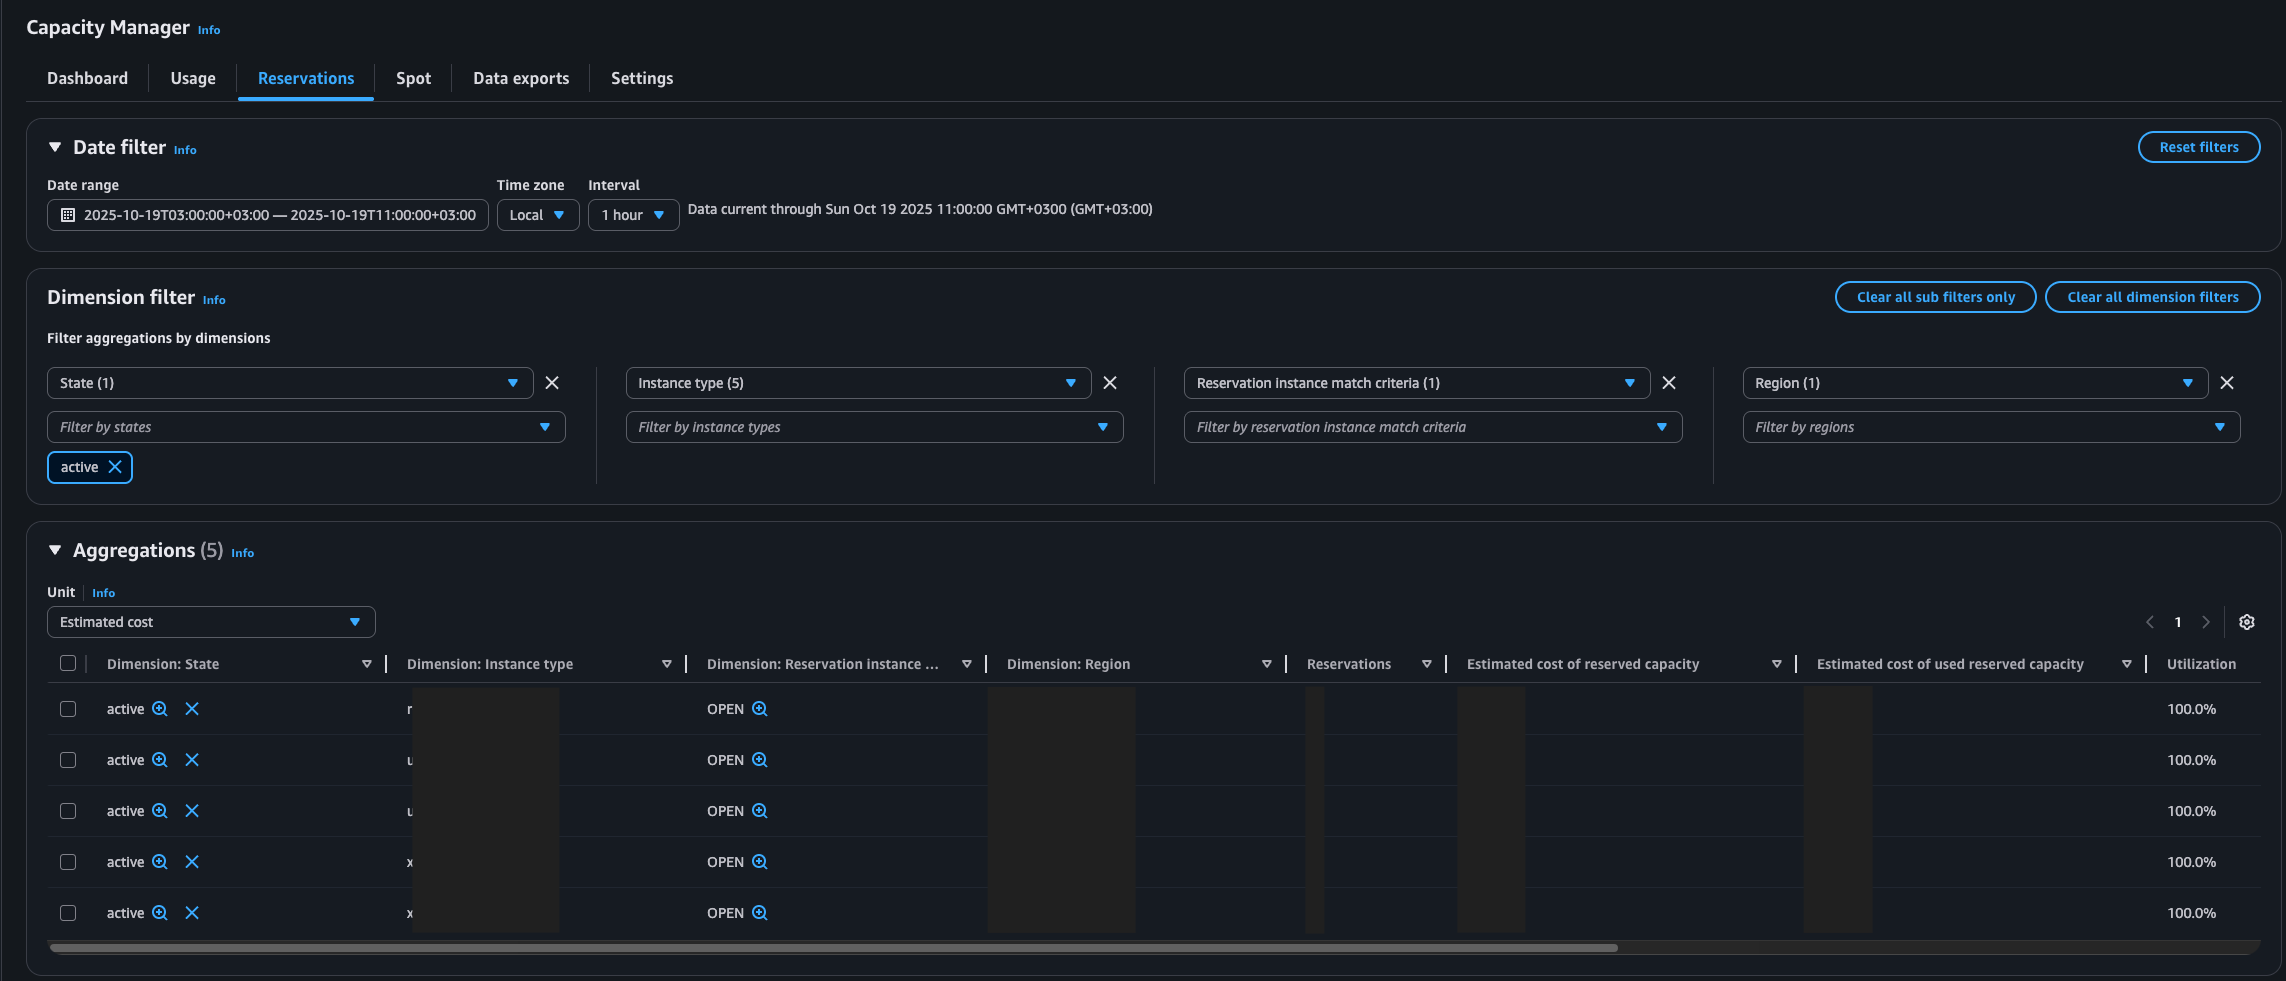
- Allows data grouping with the Dimension Filter by Account ID, Region, Instance Family, Availability Zone (AZ), and Instance Type.
- The Aggregations table provides analysis of total, reserved, and Spot usage hours by instance family.
- The “View Breakdown” option enables drilling down into specific instance types to identify detailed optimization opportunities.
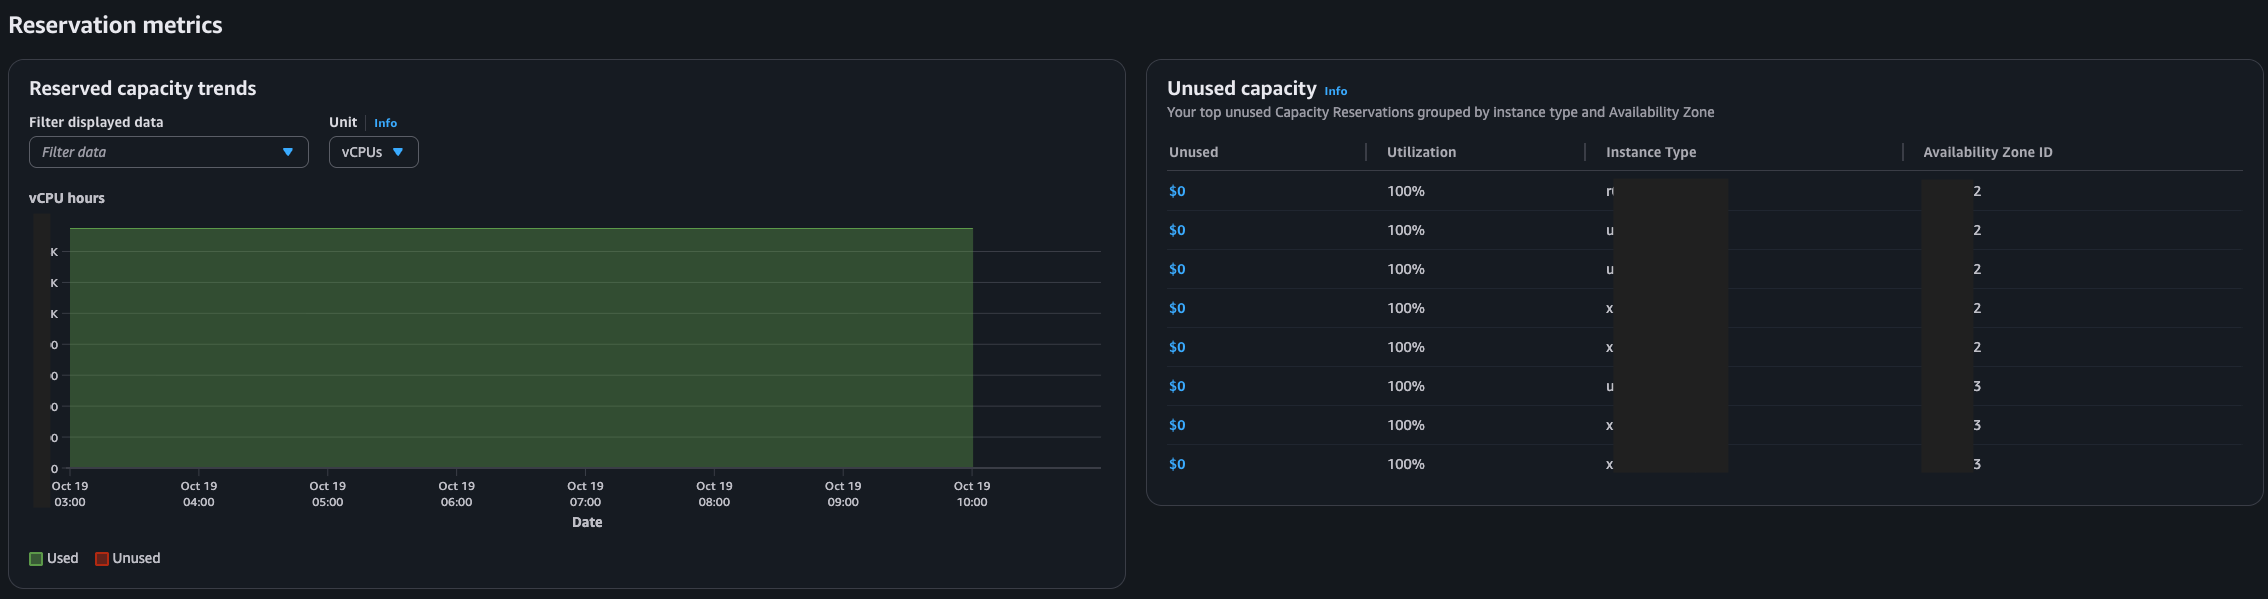
- Tracks the utilization rates of On-Demand Capacity Reservations (ODCRs).
Automatically detects underutilized reservations and provides prioritized optimization recommendations. - Displays the ratio of reserved vs. unused capacity to measure reservation efficiency.
- When the reservation exists in the same account, it allows direct modification of reservation parameters from the console.
- The Statistics section summarizes key metrics such as total reservation count, average utilization rate, and Regions with the highest or lowest utilization.

- Analyzes interruption durations of Spot Instances.
- Provides Spot placement score recommendations to help improve workload flexibility.
- Allows exporting data to Amazon S3, extending beyond the 90-day retention limit of the console.
- Enables long-term trend analysis and integration with external business intelligence (BI) tools.
- Supports creating automated export schedules for continuous data delivery.
When evaluating EC2 optimization opportunities, consider:
- CPU utilization trends over time
- Memory pressure and application behavior
- Network throughput requirements
- Reserved Instance and Savings Plan coverage
For example:
- Low CPU + low network → downsize instance
- High CPU spikes → consider burstable or autoscaling
A production workload running on m5.4xlarge showed:
- Average CPU utilization: 15%
- No significant memory pressure
After analysis:
- Instance downsized to m5.2xlarge
- Achieved ~40% cost reduction
- No performance degradation observed
At this point, the following steps should be followed for best practices:
- Always analyze at least 14–30 days of metrics
- Combine rightsizing with Savings Plans
- Avoid over-aggressive downsizing in production
- Validate changes in staging environments
I hope these article help save you time.
References: